Simple Skew Detection, As Promised
Teaching My Computer to Read, Part 3
There’s more than one way to skin a cat…or so I’ve heard. There’s also more than one way to straighten document pages, which is both more fun and more algorithmically complex.
To understand how to approach this, let’s think about what “straight” means, in this context. To state it most simply: we want the lines of the page to be horizontal. We run into complexities here when we start considering handwritten pages, where lines were written at different varying angles; we also run into problems when lines are curved, as they might be in a photograph of the pages of a thick book. For our purposes, though, we’re going to assuming that the text lines that we are looking at are printed, consistently angled, and mostly linear in form.
Some text line detection depends on finding these text lines, and then calculating a skew angle based upon them using some basic trigonometry. This seems like a natural way to go about things–how are you supposed to tell if the lines are straight if you dont know where they are?–but text line detection is its own complex beast. Such algorithms will often involve some sort of blurring or thresholding followed by a feature detection algorithm; this paper discusses blurring the image while enhancing the texture of the text lines by convolving Gaussian filters with line filters and then using a ride detection algorithm on the image; this older paper discusses a different approach that works by accumulation of pixel blobs into sets of text lines based on position.
But what if we didn’t have to find the lines first? What if we could just manipulate the pixel values into telling us when the page is satisfactorily straight?
Oh wait…we can.
(Note: This isn’t a perfect method, but thanks to numpy’s optimized matrix operations on its n-dimensional arrays, it can be quite fast; as long as the initial rotation angle of the page is within 45 degrees of its proper orientation, it will work fairly reliably, no comprehensive testing has been done to determine exact success rates at this time.)
The idea I started working with is to look at the horizontal sums of pixels across an image. Since each pixel (in a grayscale image) is represented by a single value from 0 (black) to 255 (white), if all the pixels in a row sum to 0 it means that the entire row of pixels is entirely black, and if it is equal to 255 * (width of image), then it is entirely white.
With this in mind, there are patterns to these pixel values that we can exploit when looking at pages of text. There are, for example, lines. When these lines intersect horizontal pixel rows at different angles, patterns emerge.
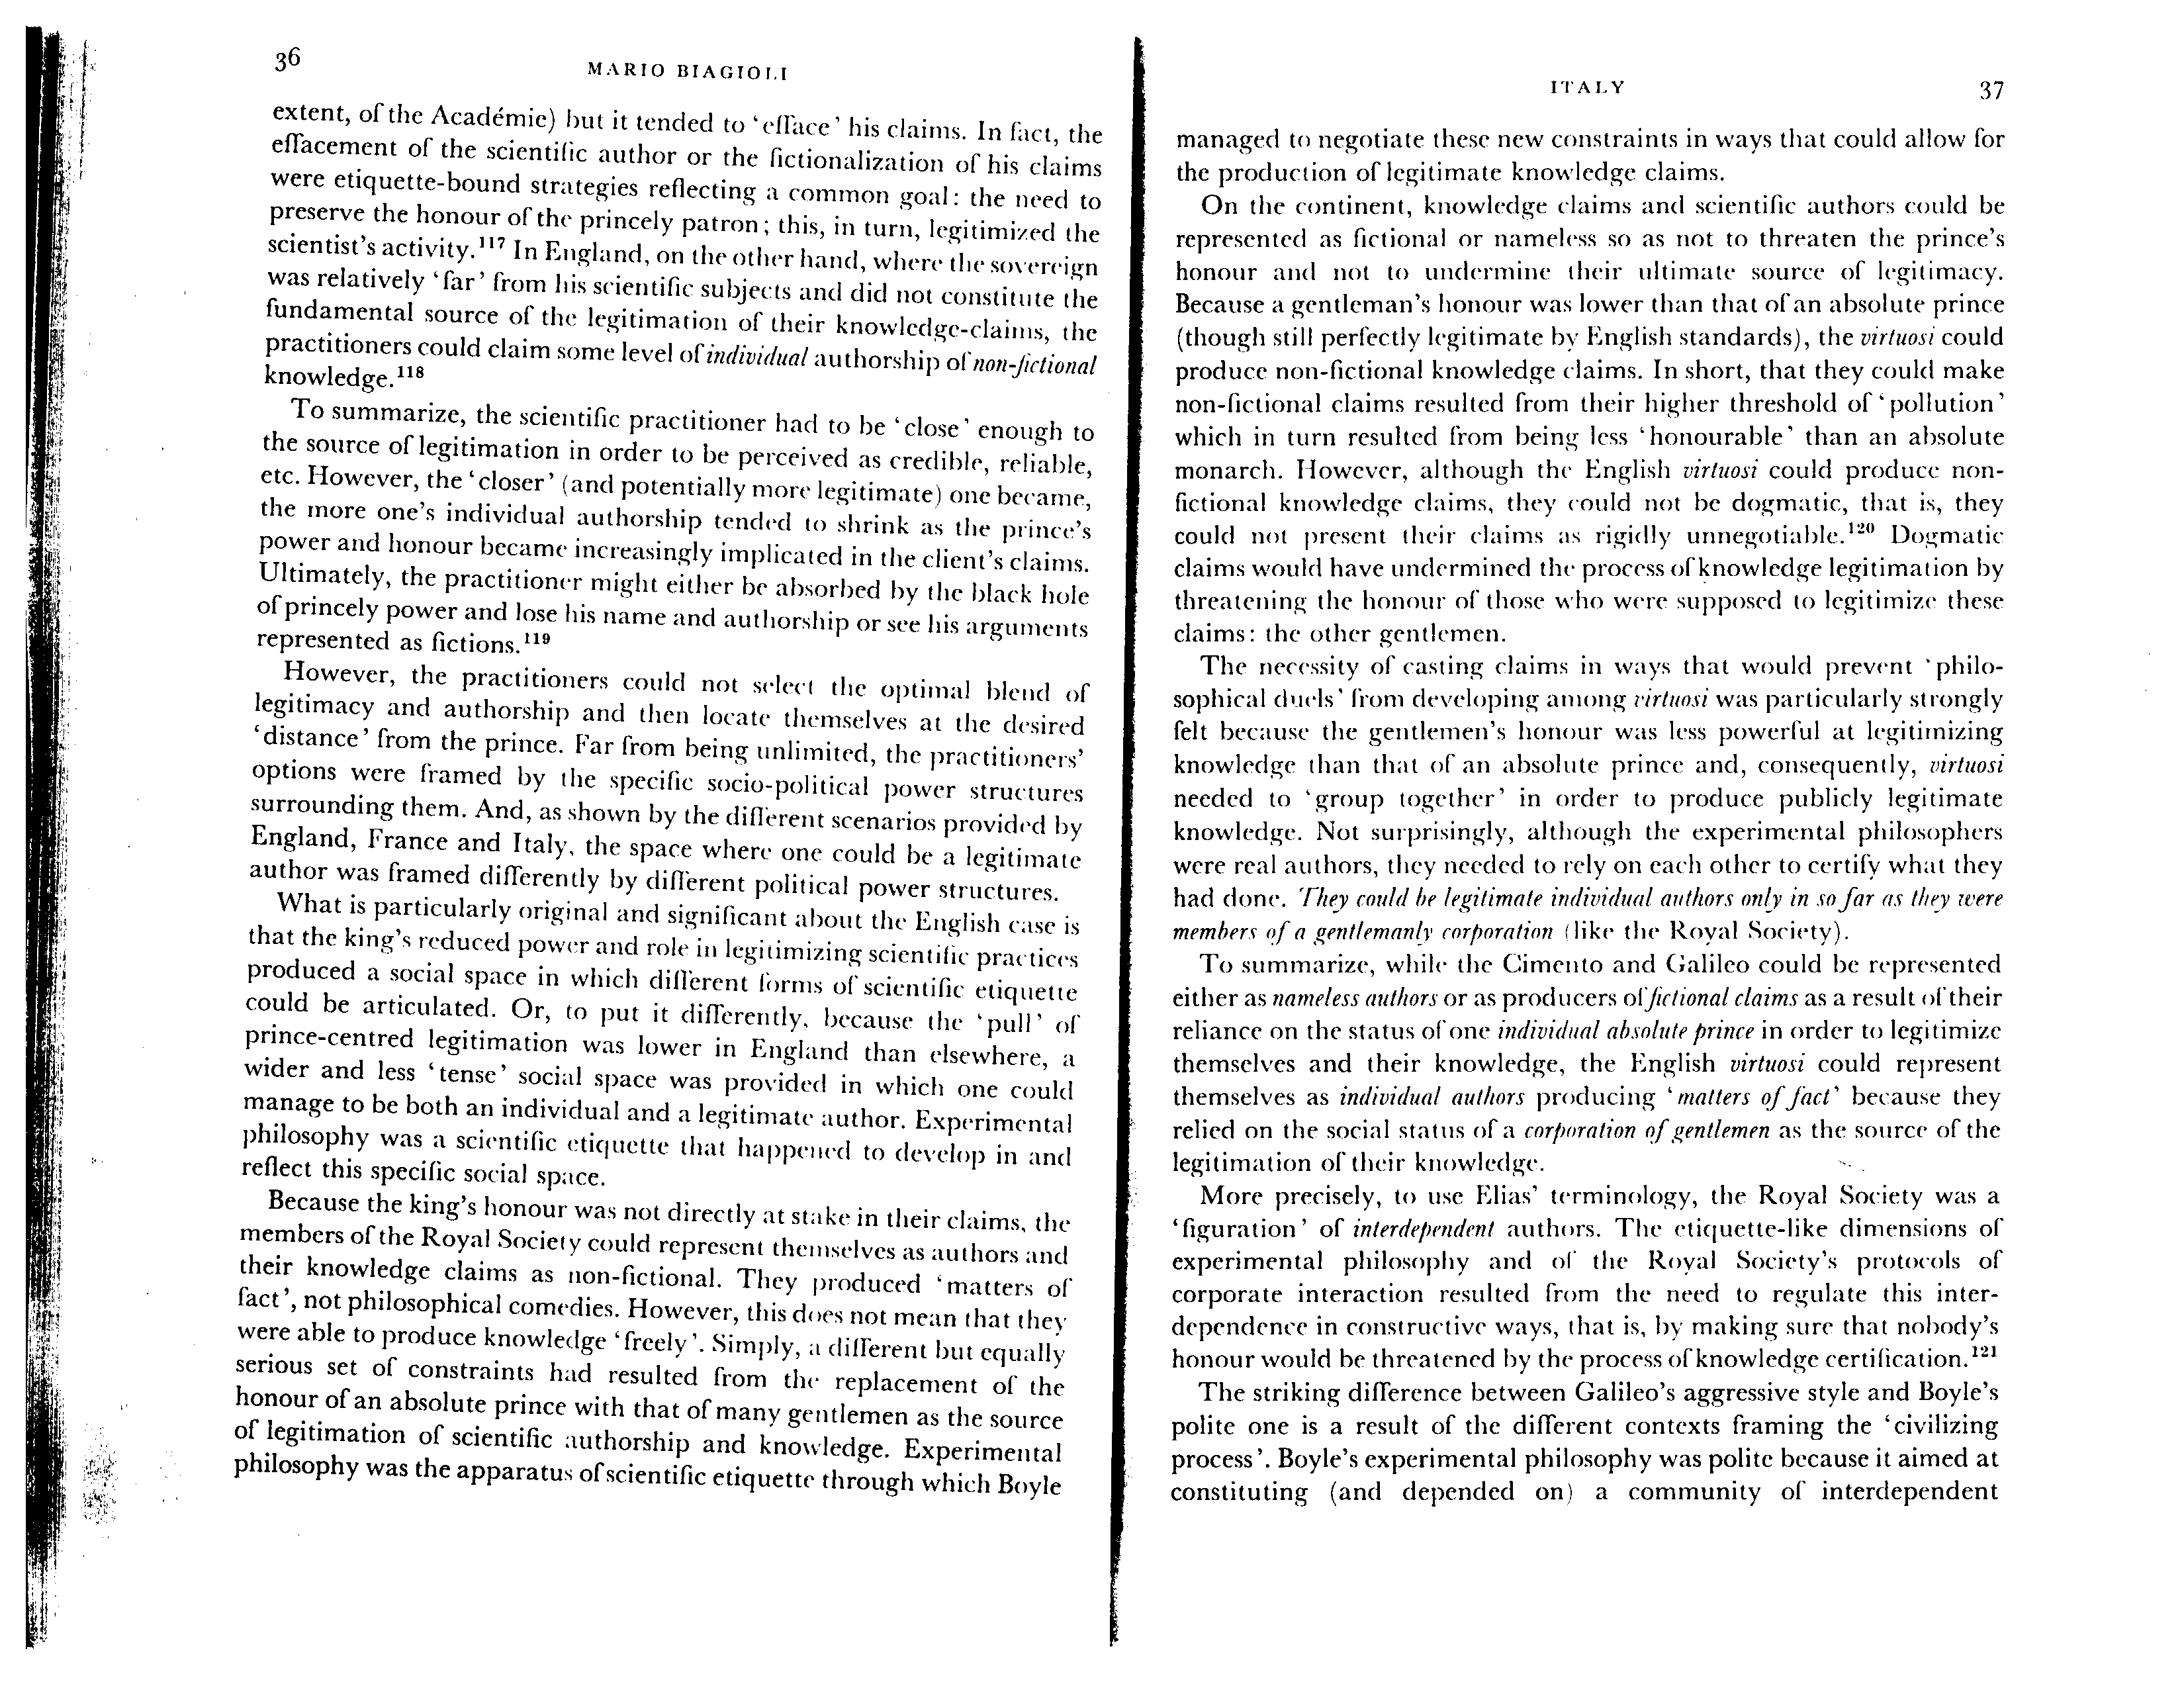
For example, let’s take a look at this page.
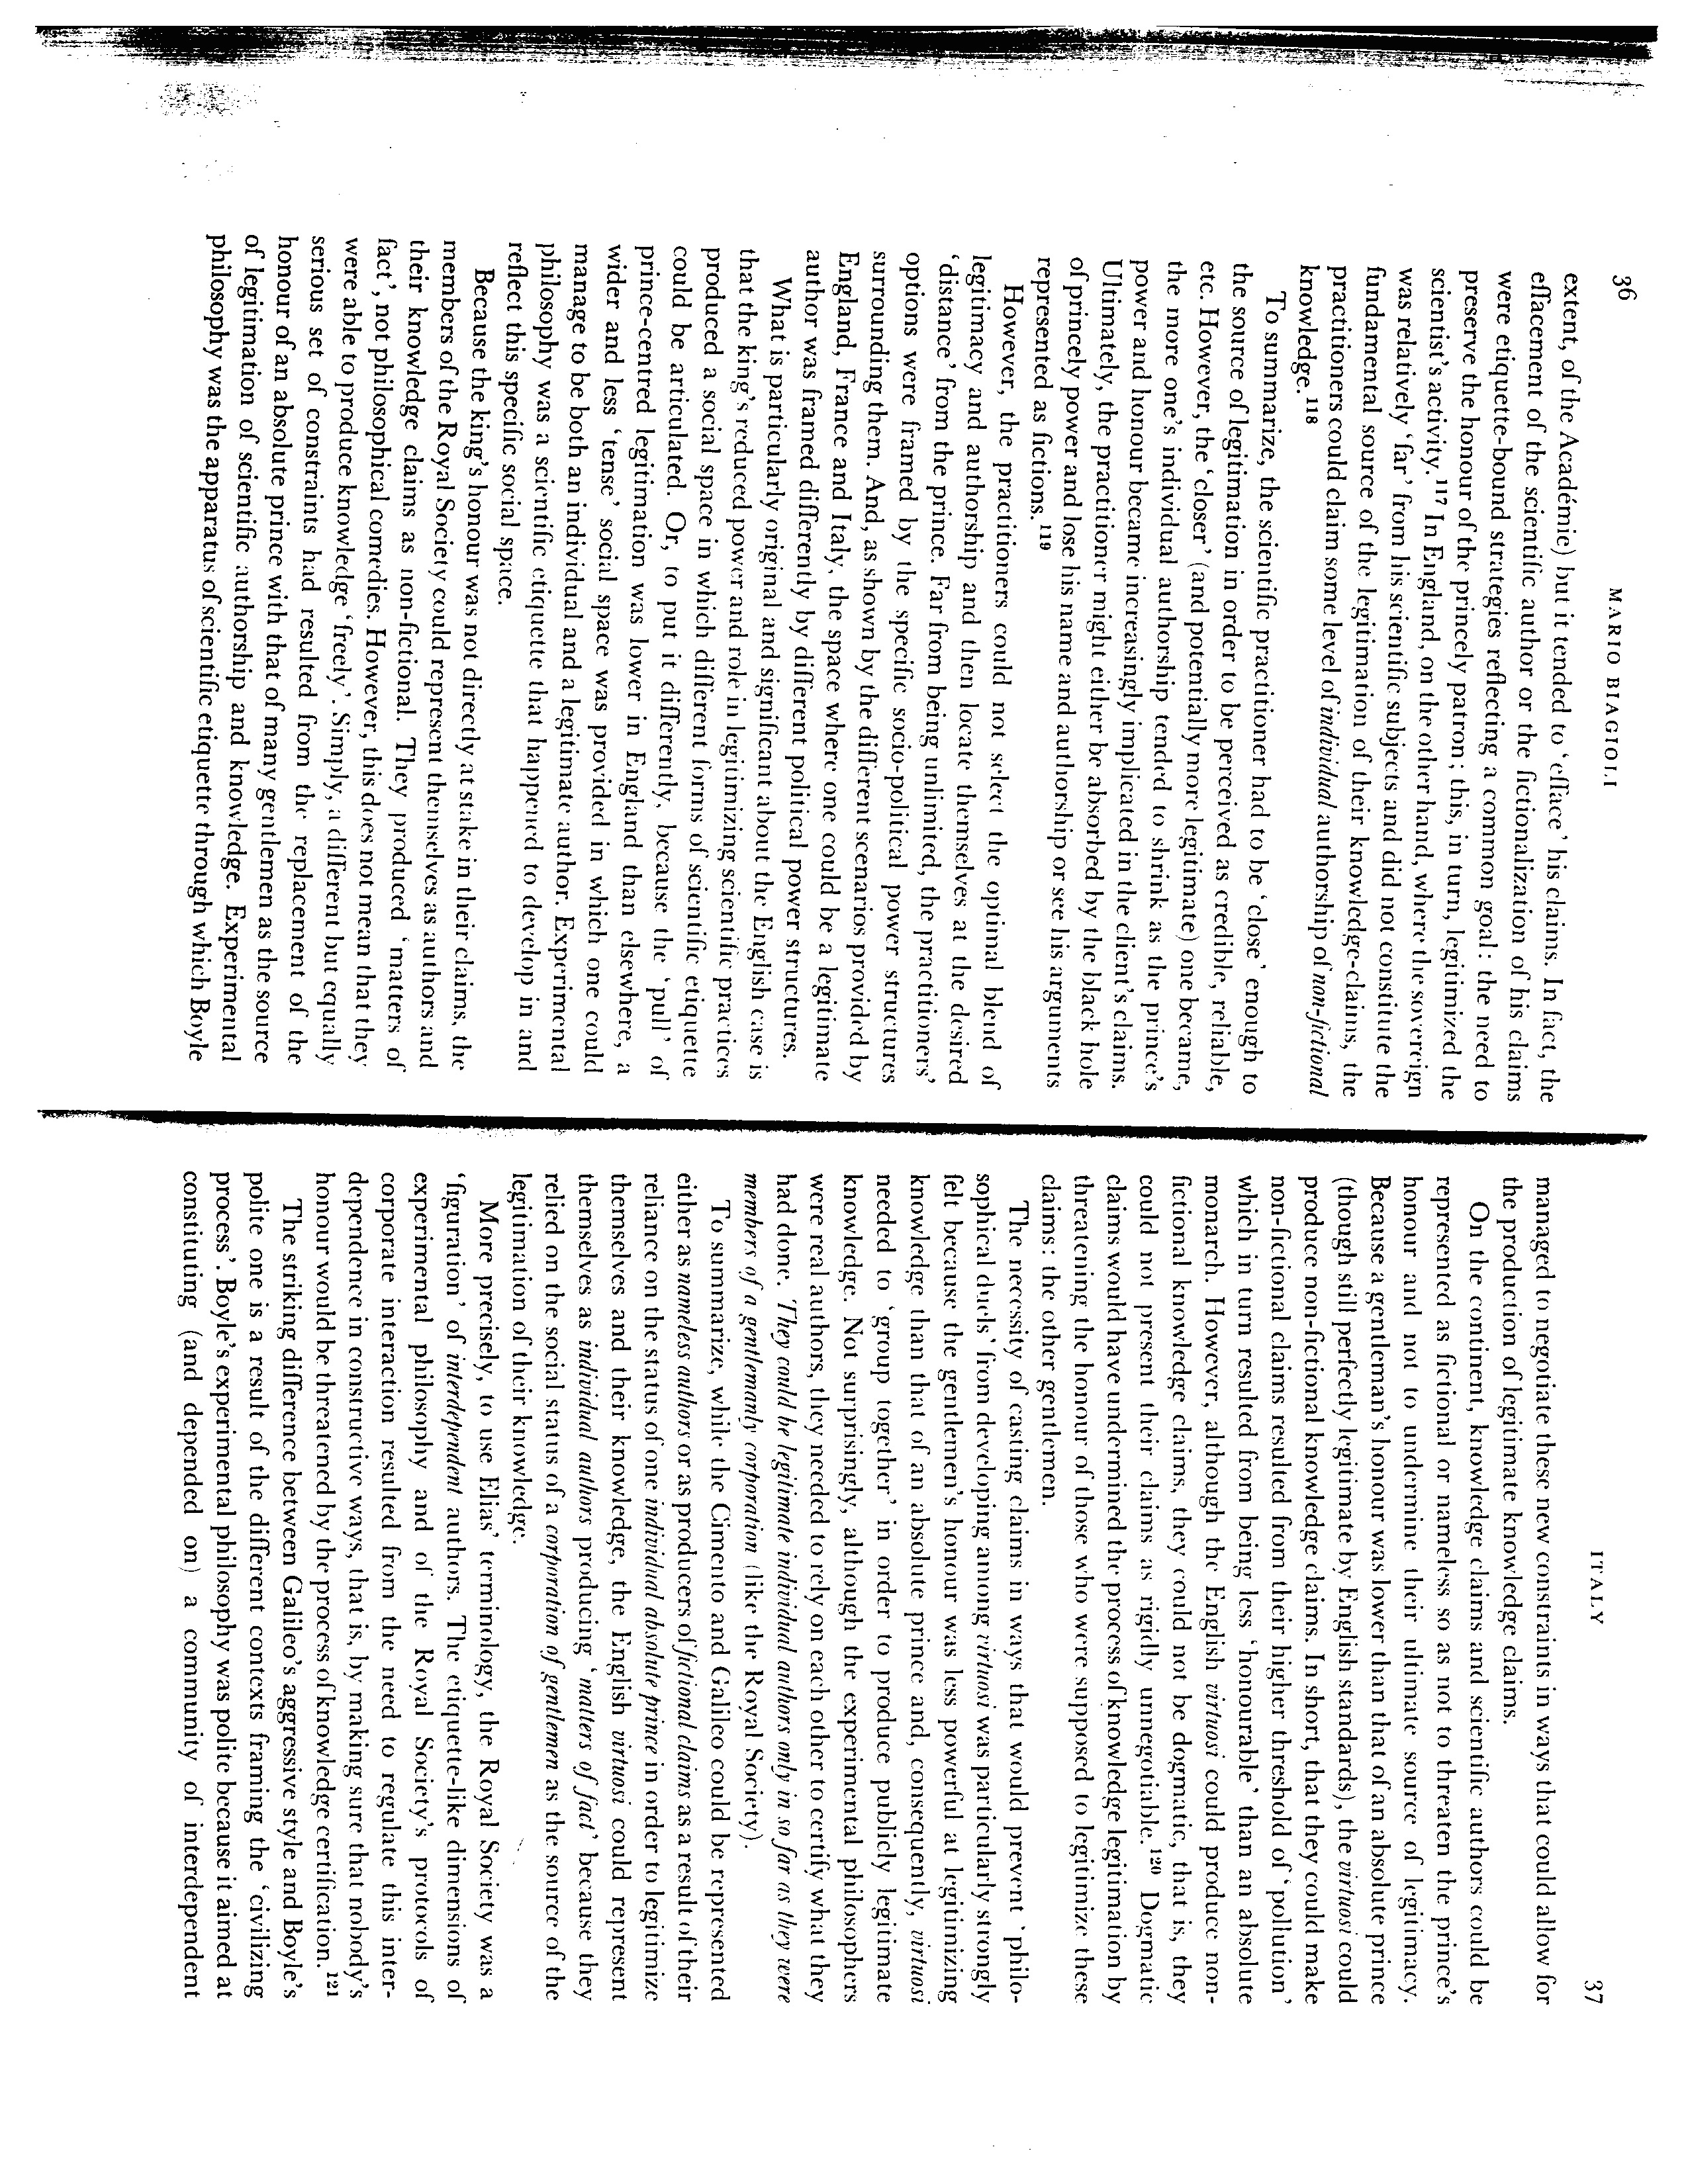
Obviously, not the best rotation angle. If we graph the row sums with the sum along the Y axis and the row number on X axis, it looks like this:
The red line represents the average pixel value.
We see some features emerge: the areas of text have values clustered rather tightly around a constant value, and the margins and horizontal black lines in those margins are represented by deep spikes and valleys.
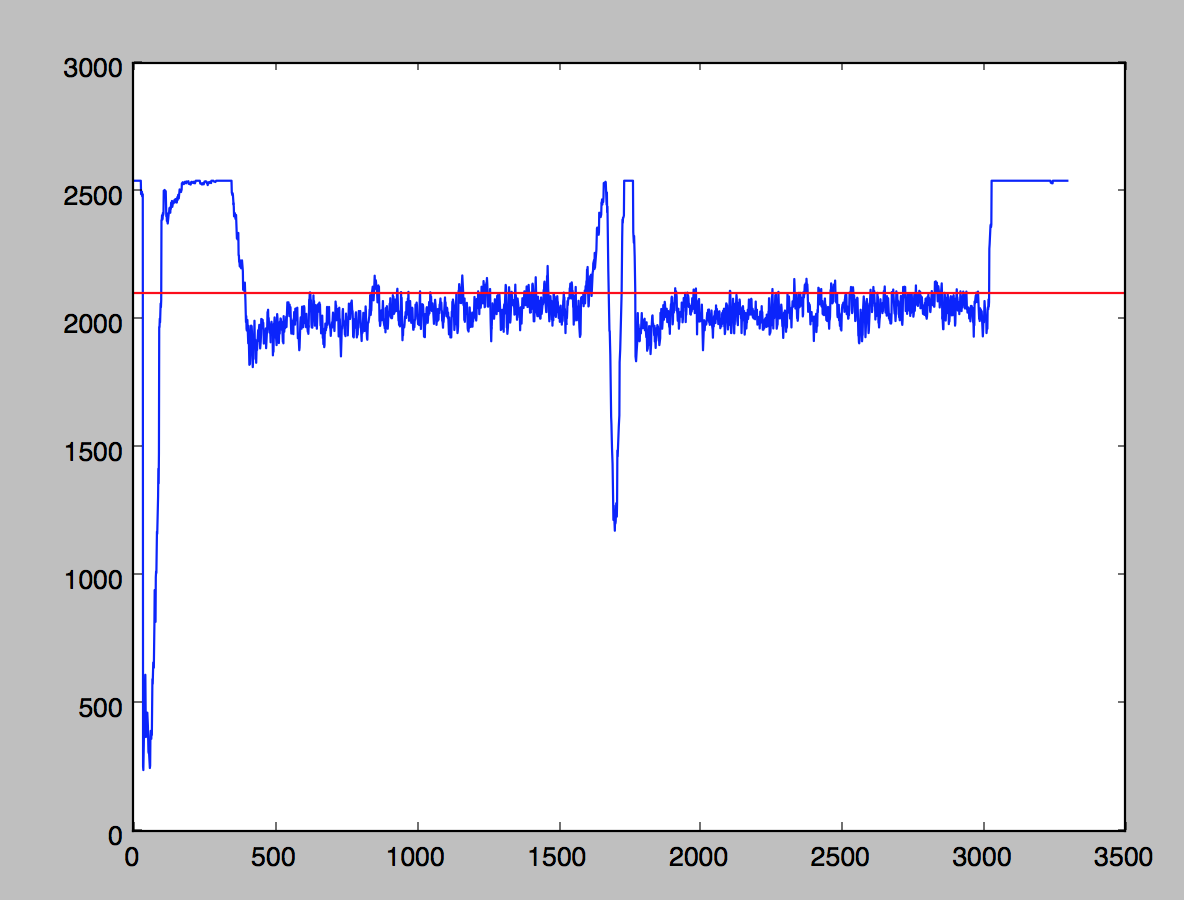
Now, if we rotate the image to its optimal angle, it looks like this:
And its graph looks like this.
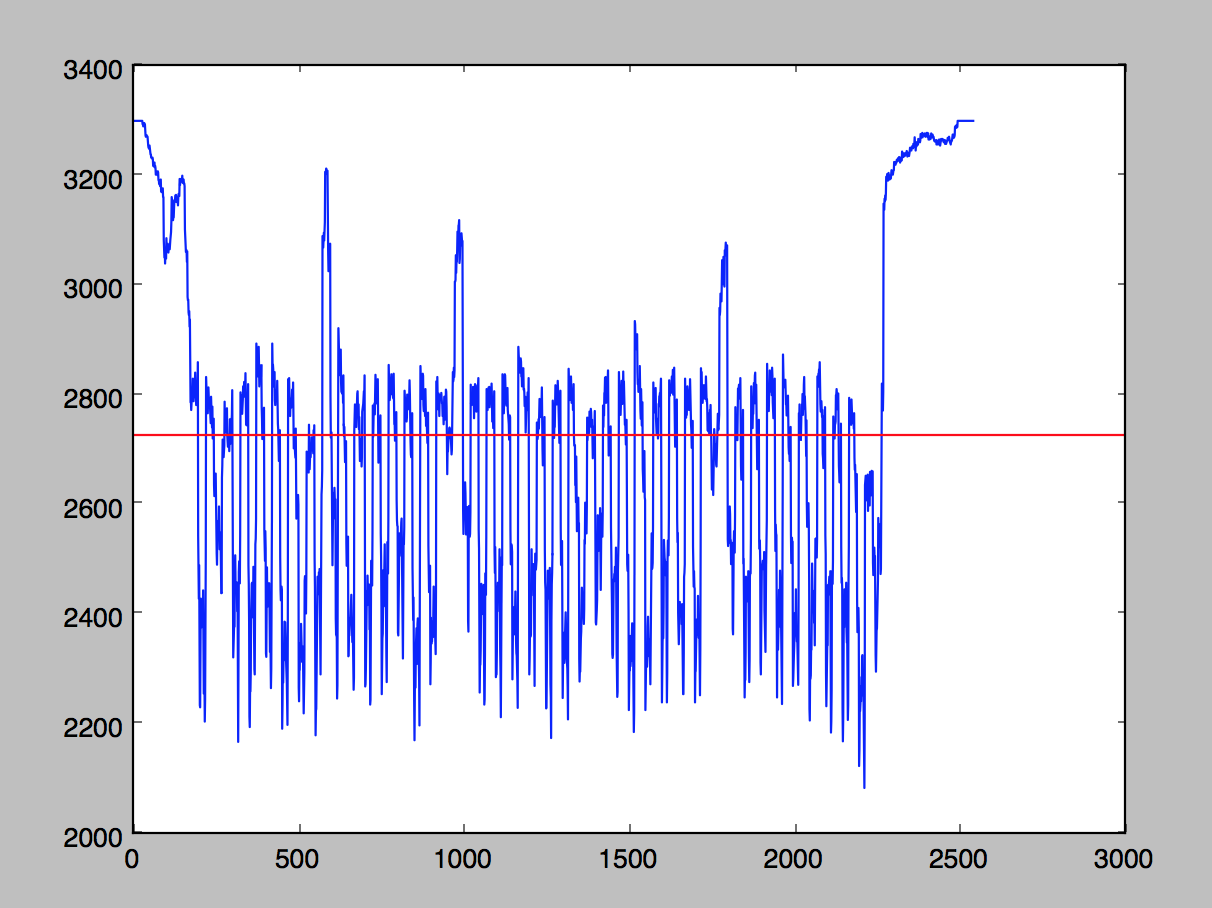
Really different! At first glance, qualitatively, this new graph looks a whole lot…spikier. There are more discernible hills and valleys, and they are much taller and wider. The valleys represent rows that follow along text lines, and the peaks represent places in which a row cuts between text lines, and is almost entirely white.
The challenge is coming up with a measure of this “spiky-ness”, and to do that we need to think about the quantitative features of this graph. Is there a good metric for examining the widths and height of these peaks and valleys?
Well…what about variance? Since the peaks are wide and their slopes are very steep, it means that more points are clustered at the extremes of the light and dark values.
As a reminder,
The variance is the average of the squared deviations from the mean, i.e.,
var = mean(abs(x - x.mean())**2).
(From numpy source.)
Numpy, conveniently, has var() method that will compute the variance of the array of row sums for us, very efficiently. As a measure of how much point values differ, it should suit our needs as a “spikiness” metric.
This what we utilize in out implementation, iterating through a series of image rotations and calculating the variance of each in an attempt to maximize.
	## Iterate through range of angles to find maximum row sum variance
	variances = {}
	for x in range(-45, 45, 5):
		variances[np.var(horizontal_sums(rotate(img, x)))] = x
	angle = variances[max(variances.keys())]
	## Iterate through a finer range of values around previous result
	for i in range(angle-5, angle+5):
		variances[np.var(horizontal_sums(rotate(img, i)))] = i
	angle = variances[max(variances.keys())]
(View the full source here.)
This is an implementation that can be optimized further, especially with regard to angle iteration–currently, the algorithm rotates the image 28 times before an optimal value is reached. It may seem inefficient that to rotate the image every time to calculate variance, but numpy’s sum function can only operate along matrix rows and columns, and accessing individual pixel values in an attempt to approximate sums of a rotated image is highly inefficient.
Overall, in our (somewhat limited) tests, this algorithm proved to be highly effective. Granted, if given free rein over all possible angles of rotation, it is completely unable to distinguish upside-down text from right-side-up text and it may be fooled by thick dark vertical lines in margins perpendicular to the text; however, as long as it is constrained to angles within 45 degrees of the proper angle, it will usualy find the correct angle, even with embedded pictures.
To solve the problem of coarse rotation, I added a new page in which the user tells us which way is up:

(It’s smoother in real life, I promise.)
And there you go! Skew detection reliable enough that I felt comfortable not including a “your algorithm messed up, let me do it myself” button anywhere…like I had to do for line detection.
Last Time: PDF Image Extraction!
Next time: Line detection!